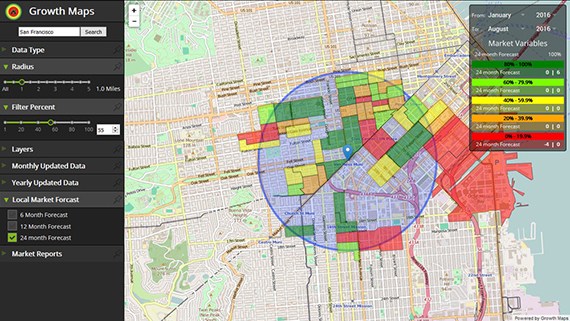
Growth Maps aggregates years of monthly data sets from 18+ reliable data brokers and sources. The data is then cleaned, organized, and overlaid with hundreds of monthly variables-some of which are listed below. Advanced real estate forecasts are applied and the platform instantly calculates growth.
| VARIABLE | CATEGORY | HOW OFTEN UPDATED |
|---|---|---|
| Job Growth Index | Economic Growth | Monthly and/or Quarterly |
| Unemployment Rate Growth | Economic Growth | Monthly and/or Quarterly |
| Median Income Growth | Economic Growth | Monthly and/or Quarterly |
| Population Growth | Demographic Growth | Monthly and/or Quarterly |
| Migration Growth | Demographic Growth | Monthly and/or Quarterly |
| New Business Index Growth | Economic Growth | Monthly and/or Quarterly |
| Vacancy Rate Growth | Economic Growth | Monthly and/or Quarterly |
| Affordability Index Growth | Economic Growth | Monthly and/or Quarterly |
| Quality of Life | Environmental | Yearly |
| Crime Rating | Demographic Growth | Yearly |
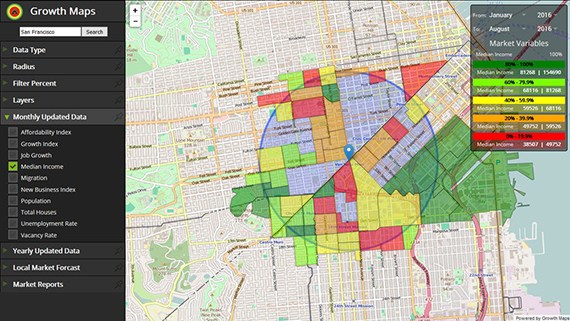
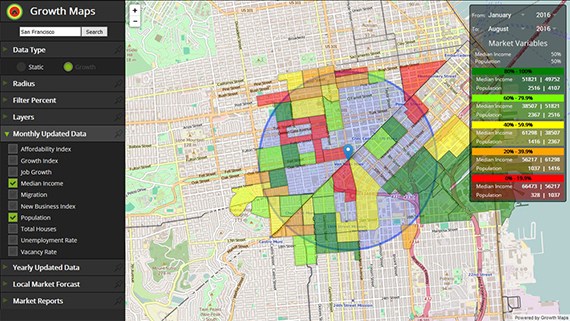
Change demographic & leading economic indicators on the fly and create powerful custom reports that instantly highlight neighborhood growth, down to city block level. Leverage real time analytics and take advantage of overlooked opportunities. Pinpoint hot buys to drive sales and profits from real estate market trends no one else has yet discovered.
Using Growth Maps gives industry professionals an edge on the competition and takes the risk out of residential and personal real estate decision making. Save time and money by learning city block trends and leading economic indicators, that can make or break a real estate deal.